There are no items in your cart
Add More
Add More
| Item Details | Price | ||
|---|---|---|---|

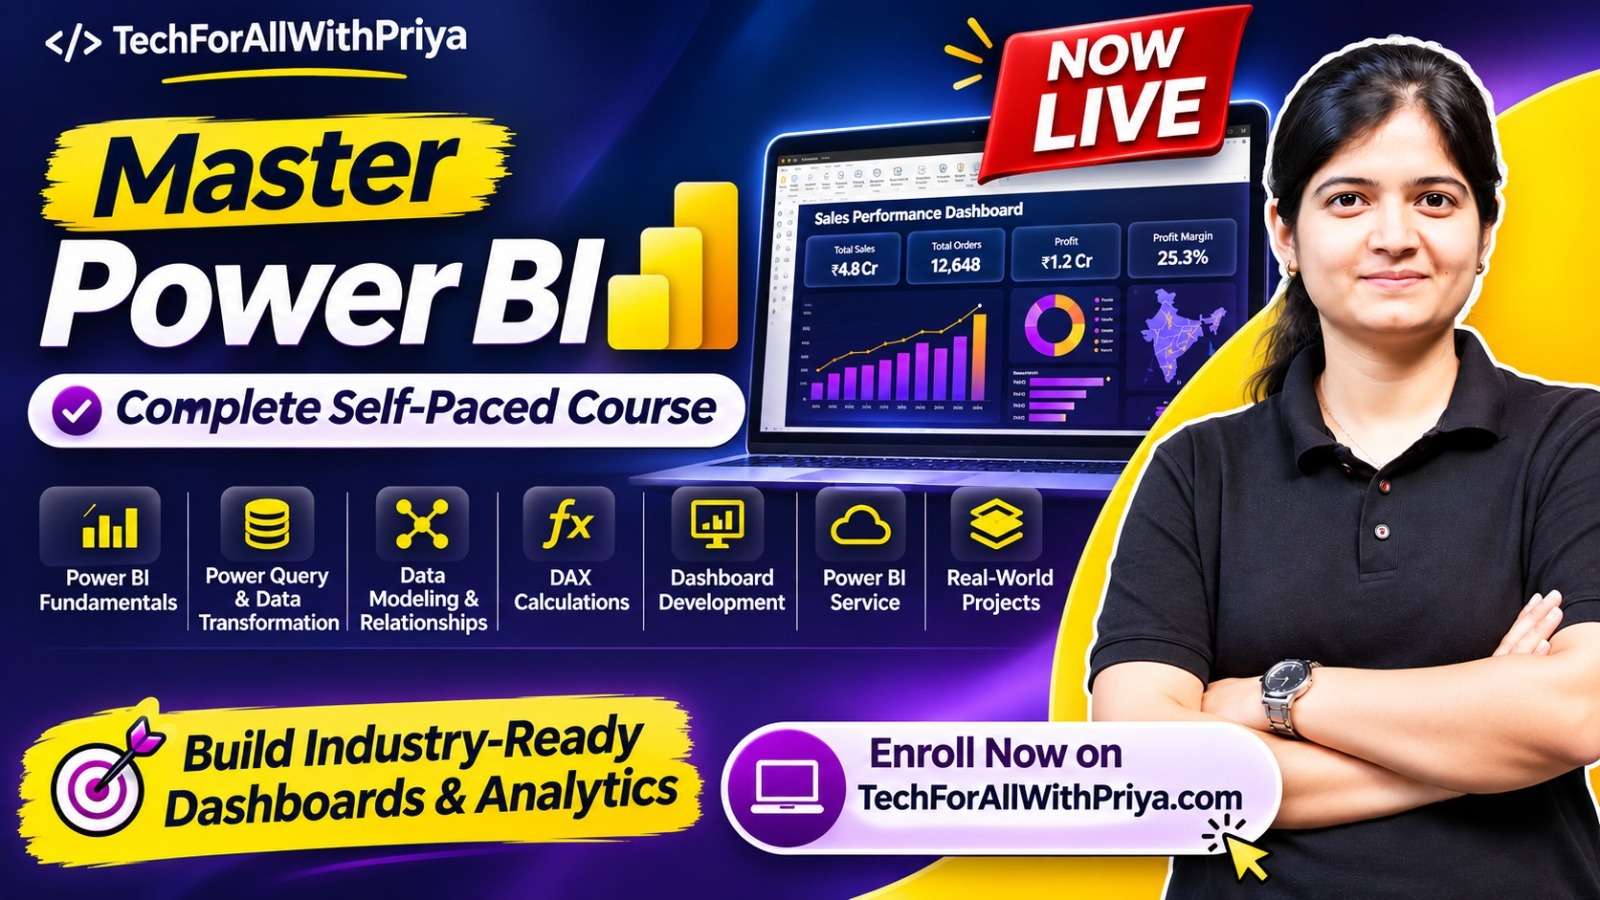
Instructor: Priya BhatiaLanguage: Hinglish
Learn how to clean, transform, model, analyze, and visualize data using Microsoft Power BI. Build interactive dashboards, uncover meaningful business insights, and develop practical Business Intelligence skills that are highly relevant in today's data-driven industry.
Whether you are starting your Data Analytics journey or looking to upgrade your existing skills, this course will help you move from working with raw datasets to building professional, insight-driven dashboards.
What you will learn:
Organizations generate enormous amounts of data every single day. However, raw data alone cannot drive business decisions.
Businesses need professionals who can transform complex datasets into meaningful insights, identify trends, track performance, and communicate findings effectively.
This is where Power BI comes into the picture.
Power BI is one of the widely used Business Intelligence and data visualization platforms that helps organizations convert raw data into interactive reports and dashboards.
By learning Power BI, you can:
The goal is not just to create charts. It is to understand the story behind the data.
Learn by Doing
Understand concepts through practical demonstrations instead of relying entirely on theoretical explanations.
Industry-Relevant Skills
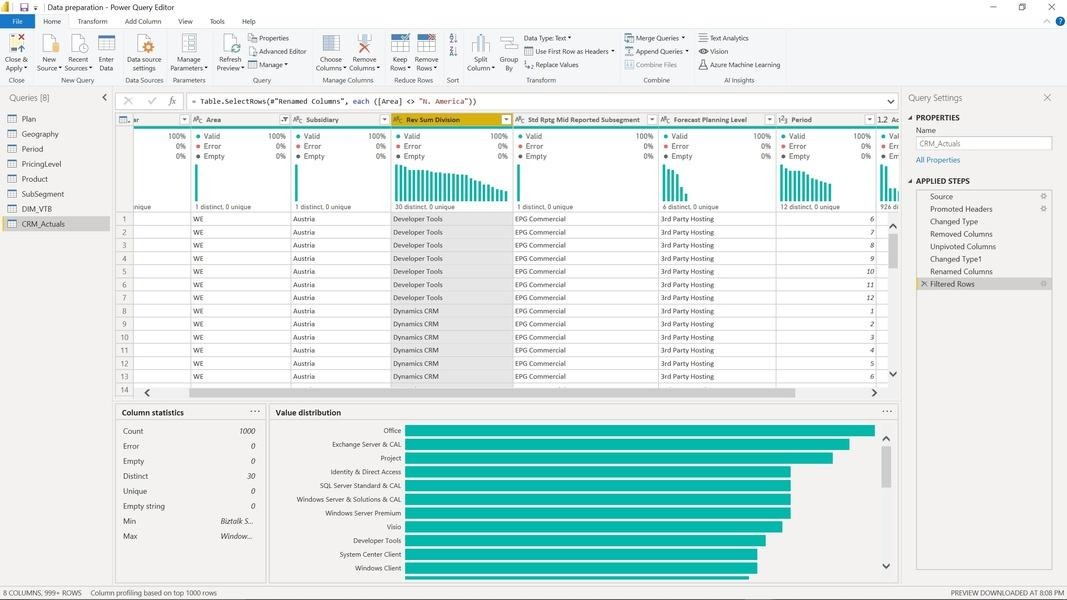
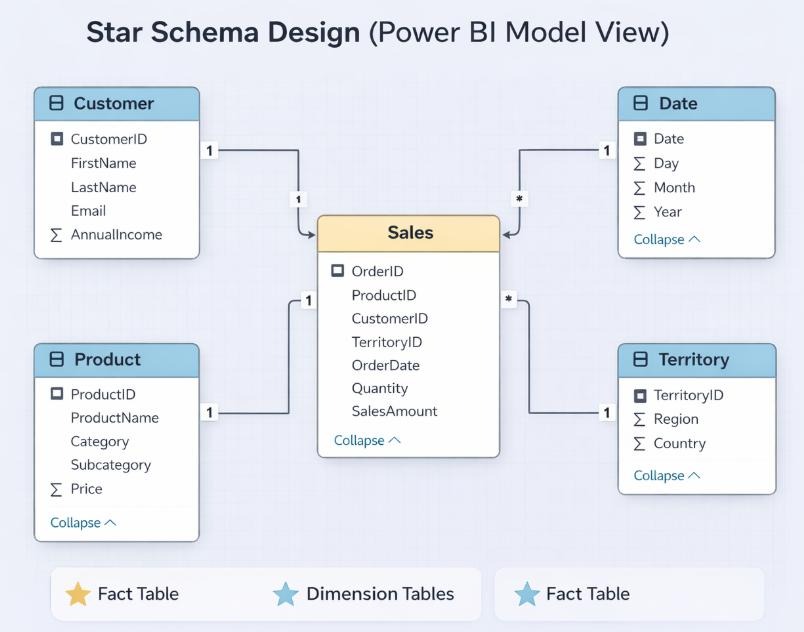
Learn Power Query, data modeling, DAX, and dashboard development, skills used in real-world analytics workflows.
Build Professional Dashboards
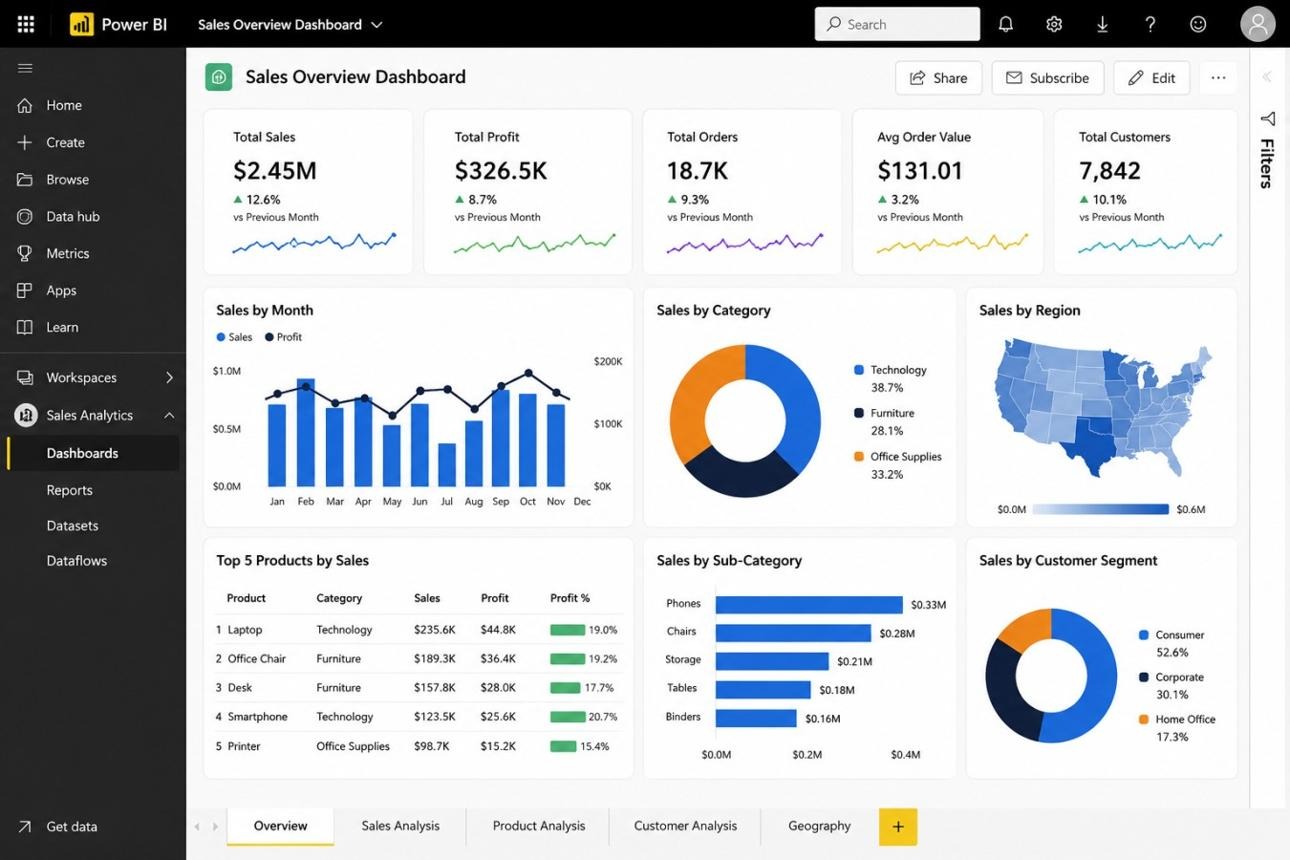
Learn to design interactive reports that communicate business insights effectively.
Learn at Your Own Pace
Access recorded sessions and revisit important concepts whenever you need them.
Learn live with top educators, chat with teachers and other attendees, and get your doubts cleared.
Our curriculum is designed by experts to make sure you get the best learning experience.
Interact and network with like-minded folks from various backgrounds in exclusive chat groups.
Stuck on something? Discuss it with your peers and the instructors in the inbuilt chat groups.
With the quizzes and live tests practice what you learned, and track your class performance.
Flaunt your skills with course certificates. You can showcase the certificates on LinkedIn with a click.